But a study has suggested a new way to deal with plastic waste.
The Swiss research suggests a proof-of-concept idea of a new approach to plastic recycling – inspired by the way nature ‘recycles’ the components of organic polymers present in our environment.
Proteins inside organic polymers are constantly broken down into parts and reassembled into different proteins.
Researcher Simone Gavieri wrote: “A protein is like a string of pearls, where each pearl is an amino acid. Each pearl has a different colour, and the colour-sequence determines the string structure and consequently its properties.
“In nature, protein chains break up into the constituent amino acids and cells put such amino acids back together to form new proteins, that is they create new strings of pearls with a different colour sequence.”
Professor Francesco Stellacci, of EPFL, said: “We selected proteins and divided them up into amino acids. We then put the amino acids into a cell-free biological system that assembled the amino acids back into new proteins with entirely different structures and applications.”
Giaveri and Stellacci successfully transformed silk into a protein used in biomedical technology.
Stellacci said: “Importantly, when you break down and assemble proteins in this way, the quality of the proteins produced is exactly the same of that of a newly-synthesised protein. Indeed, you are building something new.”
Stellacci said it would take time to develop a working method to recycle plastic in this way.
He added: “It will require a radically different mindset. Polymers are strings of pearls, but synthetic polymers are made mostly of pearls all of the same colour and when the colour is different the sequence of colour rarely matters.
“Furthermore, we have no efficient way to assemble synthetic polymers from different colour pearls in a way that controls their sequence.”
Research this year found that thousands of rivers, including smaller ones, are responsible for most of the plastic pollution worldwide.
Previously, scientists believed that 10 large rivers – such as the Yangtze in China – were responsible for the bulk of plastic pollution.
In fact, 1,000 rivers – just 1% of all rivers worldwide – carry most of the plastic to the sea.
The research means that areas like tropical islands are likely to be among the worst polluters, the researchers said.
The study by non-profit organisation The Ocean Cleanup used measurements and modelling to work out that 1,000 rivers worldwide are behind 80% of plastic emissions.
Nelson and Wellington residents tied for first in the regional battle for the lowest carbon footprint. But while Nelson’s total emissions had the largest decrease between 2018 and 2019, according to Statistics NZ data, the capital’s headed in the opposite direction.
Both regions produced 6.6 tonnes of carbon dioxide for every resident in 2019. Auckland came in third place, with a per-person total of 6.7 tonnes.
At the other end of the spectrum, Southland produces nearly nine times as much greenhouse gas for every resident, courtesy of its dairy farms and the Tiwai Point aluminium smelter. Taranaki and Waikato had the second and third highest figures.
In 2019, experts advised the world to cut greenhouse gas output by about 8 per cent a year, to limit global warming to 1.5 degrees Celsius. Data released Wednesday suggests Nelson residents took that call to heart.
Households slashed their footprints by 19 per cent, according to the Statistics NZ report. Personal travel pollution fell from 110 tonnes in 2018 to 88 tonnes. Emissions from primary industries in the region also plummeted by 12 per cent. Some of these gains were offset by slight rises in pollution from manufacturing, electricity generation and waste.
Nelson residents’ annual footprint of 6.6 tonnes is even more impressive considering it does not have as many jobs in government departments, head offices and financial services as Wellington or Auckland.
Although small, the Nelson region recorded the largest emissions decrease, as total emissions fell 8 per cent in 2019. MARTIN DE RUYTER/STUFF
Nelson City councillor Kate Fulton has worked for 11 years to achieve emissions cuts in the region.
“It’s very exciting to see stats like that, because you think we’re heading in the right direction,” she added.
“People really started to pay attention when we had a couple of years of heavy rainfall events – and in 2018, Cyclone Gita and Fehi really impacted our region – and then we had a very dry summer and some intense fires. It was around the same time fires were happening in Australia and Brazil. Perhaps people are seeing the effects of climate change now in their immediate environment plus in parts of the world that they love, and that makes them want to do more individually.”
On the transport front, the council has encouraged people to minimise car journeys, and walk and cycle where they can. But with neighbouring Tasman’s transport emissions rising, there’s more work to do, she added.
“We’ve really supporting things like minimising and diverting food waste from landfill and increased the planting of trees.”
Cities rely on other regions for food and power, and must help ease that burden, Fulton said. To help reduce emissions in Nelson and at Waikato’s Huntly power plant, the council is encouraging new houses that are central, connected, high performing and installed with solar panels.
“We need to really think about how our personal choices benefit the country, plus the planet.”
All up, Nelson cut 8 per cent off its footprint – the best result in the country. Close neighbour Tasman also had a reasonable drop: 3.9 per cent.
Solar panels on homes around the country could help Waikato to produce fewer emissions, a Nelson councillor suggests. SUPPLIED
Gases also fell 1.5 per cent in Canterbury, as animal numbers declined. Since the province’s total is so large, this translated into an emissions reduction equivalent to 180,000 tonnes of carbon dioxide, Statistics NZ found.
But these efforts failed to counteract the large increases in other areas. Altogether, national emissions rose 2.1 per cent.
Emissions are allocated to the region where they are created. So all the emissions from the Huntly power plant are added into Waikato’s tally, even though many regions rely on its electricity.
The data also doesn’t count regions’ carbon sinks, for example the carbon sucked up by native forests.
Wellington had a mixed year. Households contribute the bulk of the capital’s pollution, and emissions from personal travel had a 1.9 percent bump in 2019. The region includes farms on the Kāpiti Coast and the Wairarapa, where agricultural gases rose by 5.2 percent. Transport and logistics had a small rise.
But in 2019, 6700 new residents shifted to the capital. So while the city’s total pollution rose, it was still able to tie with Nelson for the smallest per-person footprint.
Due to its service industries and high population, Wellington had the lowest per-capita carbon footprint (tied with Nelson). 123RF
Greater Wellington Regional councillor Thomas Nash said the rise was still disappointing. “Really it’s the total amount that matters for the climate,” he added. “We need to be able to welcome more people into our towns and cities in this region without increasing emissions and in fact, while decreasing emissions.”
That would mean funding public transport, allowing high-density and connected housing and supporting farmers to produce lower-emissions food and drink, Nash said. “There should be a national and regional focus on natural infrastructure… healthy soil, native wetlands, native forest, coastal environments.”
The capital relies on economic activity elsewhere to power its service-based economy. Exports from agriculture and heavy industries keep the economy humming (particularly during the pandemic).
Because of farms and metal-making, Southland’s per-resident carbon footprint remained the highest in the country for the second year in a row. The data shows the dollars these industries bring come at a high carbon cost.
For every million dollars of GDP, Southland produces more than 900 tonnes of carbon dioxide – also the highest in the country. Wellington has the lowest: under 90 tonnes for every million in GDP.
However, Southland’s emissions fell a smidgen – 0.5 percent – in 2019, even as 1000 people shifted to the province.
Of all the regions, Waikato had the biggest emissions blow out, with a 7.5 percent rise. Low rainfall in 2019 meant generation by the hydro dams fell. Power plants, including Huntly, picked up the slack.
Waikato could record similar increases in 2020 and 2021, as record amounts of coal have been imported in the last two years, due to low hydro generation and gas shortages.
The region’s household emissions also had a significant rise, mostly from a large increase in personal travel. This could be explained by the nearly 10,000 people that moved to the area in 2019, with some continuing to commute to Auckland.
Waikato’s emissions added to Auckland’s and Canterbury’s figures contribute nearly 50 percent of the country’s greenhouse pollution, said Statistics NZ’s Stephen Oakley.
That’s expected, given the high concentration of agriculture and industry, plus higher populations, in these areas.
Compared to national emission data, the regional breakdown helps central and local governments understand how best to start reducing gases, he added. “When you look across all of the 16 regions, you can see that different regions have different things that are driving it.”
Here are the highs and lows for each region:
NORTHLAND
Share of emissions: 6 percent
The bad news: Emissions rose 2.3 percent between 2018 and 2019, higher than the national average. This was mostly from manufacturing.
The good news: Agricultural emissions fell by 4.8 percent, though this could be due to farmers reacting to drought conditions, which have plagued the region.
AUCKLAND
Share of emissions: 13.7 percent
The bad news: Greenhouse pollution from manufacturing and agriculture increased. In total, emissions rose by 1.4 percent.
The good news: Emissions from households fell, as people drove less. The region has one of the lowest per-capita carbon footprints, at 6.7 tonnes per resident.
Like many regions, the City of Sails recorded a rise in total emissions between 2018 and 2019, though people drove less. ABIGAIL DOUGHERTY/STUFF
WAIKATO
Share of emissions: 19.1 percent
The bad news: Emissions rose by 7.5 percent in 2019. Waikato is the home of the Huntly power plant, which picks up the slack in drier conditions. Its largest source of emissions is agriculture, and this tally increased by 1.5 percent. Waikato’s personal travel emissions also shot up.
The good news: There isn’t much. Even though nearly 10,000 people moved to Waikato, it’s per-capita footprint ballooned in 2019 to 32.2 tonnes per resident.
BAY OF PLENTY
Share of emissions: 4.2 percent
The bad news: The region’s emissions rose 4.4 percent – higher than the national average. Both agricultural and manufacturing greenhouse gases rose.
The good news: Residents have the fourth-lowest per-person carbon footprint in the country.
GISBORNE
Share of emissions: 1.6 percent
The bad news: The area has the fifth-highest per-capita carbon footprint.
The good news: There’s plenty: Gisborne’s emissions fell 3.5 percent, even as its population grew in 2019. Greenhouse pollution from agriculture, forestry and fishing fell, as did household emissions.
HAWKE’S BAY
Share of emissions: 4 percent
The bad news: The region’s emissions rose 1.2 per cent from 2018 to 2019.
The good news: Household emissions fell by 3.3 per cent.
Home to the gas industry and fossil fuel-linked manufacturing, the Taranaki region has a relatively high per-capita footprint. ANDY JACKSON/TARANAKI-DAILY-NEWS
TARANAKI
Share of emissions: 7.4 percent
The bad news: Taranaki’s emissions tally rose 4 percent. Residents have the second-highest carbon footprint, at 49.5 tonnes each.
The good news: Emissions from electricity generation in the region fell.
MANAWATŪ-WHANGANUI
Share of emissions: 7.4 percent
The bad news: Manufacturing emissions jumped up 12 percent.
The good news: The region’s largest contributor to emissions, agriculture, had a 1.7 percent drop. Across all sectors, greenhouse gas output fell by 0.5 percent.
WELLINGTON
Share of emissions: 4.3 percent
The bad news: Farms and households contributed more emissions in 2019 than in 2018. All up, the capital’s tally was 2.6 percent larger (a figure above the national average).
The good news: Wellington’s population increased, so the per-person carbon footprint fell to 6.6 tonnes – the smallest in the country (tied with Nelson).
TASMAN
Share of emissions: 1 percent
The bad news: In 2019, manufacturing and construction pollution rose by 6.9 percent.
The good news: Since emissions from households and the primary industries fell, the region’s total footprint fell by 3.9 percent.
The Tasman region’s carbon tally achieved the second-largest decrease between 2018 and 2019, falling by 3.9 per cent. ALDEN WILLIAMS/STUFF
NELSON
Share of emissions: 0.4 percent
The bad news: There were small increases in manufacturing, electricity and waste emissions.
The good news: With big drops in emissions from primary industries and households, the region has earned the acclaim of the lowest per-person carbon footprint (6.6 tonnes), tied with the capital.
MARLBOROUGH
Share of emissions: 0.9 percent
The bad news: Agricultural gases rose, leading to the region’s emissions increasing by 3.4 per cent – more than the national average.
The good news: Household pollution fell by 4.9 per cent. Emissions from forestry and fishing also fell slightly.
WEST COAST
Share of emissions: 1.7 percent
The bad news: Agricultural and mining emissions both rose, causing the region’s tally to increase by 3.1 per cent. At 43.1 tonnes, the West Coast has the third-highest per-person carbon footprint.
The good news: Pollution from personal travel fell 6 per cent.
The number of dairy cows in Canterbury fell between 2018 and 2019, which contributed to the region’s emissions falling. CHRIS SKELTON/STUFF
CANTERBURY (including Chatham Islands)
Share of emissions: 14.2 percent
The bad news: Manufacturing emissions rose 6 per cent.
The good news: Agricultural gases – by far the largest share of the pie – fell by 2.6 per cent. This, along with a reduction in household pollution even as more people arrived, meant the region’s tally fell by 1.5 per cent.
OTAGO
Share of emissions: 6.4 per cent
The bad news: Agriculture also leads the pack in Otago’s emissions tally. After this sector had a 3 percent increase in emissions, the region’s total rose by 2.6 percent.
The good news: Emissions from electricity dropped slightly.
SOUTHLAND
Share of emissions: 7.4 percent
The bad news: Agriculture and manufacturing (think the aluminum smelter) are the area’s biggest contributors. With a per-capital tally of 59.9 tonnes in 2019, Southland remains an emissions-intensive region.
The good news: A drop in farming gases more than made up for an increase in manufacturing emissions, so the region’s total fell 0.5 per cent in 2019.
The maritime sector is prepared to pay extra for using clean fuel to transport its cargo over one that emits more greenhouse gases, said Søren Skou, chief executive of Danish shipping giant AP Moller-Maersk.
Speaking at a virtual session at the Ecosperity sustainability conference on Tuesday, Skou said that more than half of its 200 largest customers have met – or are in the process of setting – signed science-based or zero-carbon targets that will force them to cut emissions that directly and indirectly impact their value chains. Its major customers include German car manufacturer BMW Group and clothing multinationals H&M Group, Levi Strauss & Co. and Marks & Spencer, among others.
“We are today selling a biofuels-based carbon neutral transportation product which is growing quite nicely from a very small base. But nevertheless, there are customers out there in container shipping that are willing to pay a [green] premium [for low-carbon fuel],” Skou told panellists in the event hosted by Singapore investment firm Temasek.
Maersk signed a contract in August to secure green methanol—produced by using renewable sources such as biomass and solar energy—as the world’s largest shipping firm gears up to operate its first carbon-neutral ship in 2023. With about 90 per cent of world trade transported by sea, global shipping accounts for nearly three per cent of the world’s carbon emissions. Maersk needs to have a carbon neutral fleet by 2030 to meet its target of net-zero emissions by 2050.
While those who can afford to pay the green premium are big global brands which comprise only 10 to up to 20 per cent of the business, Skou noted that customers in other transport sectors like aviation are likewise able to pay for it.
“I think the world can actually pay for decarbonisation. We can afford this if we want to, [like adding] US$50 to the cost of an international airlines flight. For me the issue is more [about] scaling,” he said.
The scale-up of the production of new fuels will require getting global and regional regulations in place, raising efficiency standards, and gettinggovernments to cut bureaucratic red-tape and slash the time for the approval of permits for low carbon technologies, he shared.
Juliet Teo, head of transportation and logistics at Temasek, said that the only mechanism that would work would be to shift the cost of the premium to all the customers along the value chain. This could mean more expensive products for consumers.
“Unfortunately, the transportation industry has the poorest record of getting its customers to help with paying any additional fuel cost. Whether it’s extra fuel surcharge that you have to pay when you fly, or charging additional bunker costs to customers for shipping, it’s very hard. It hasn’t been very successful,” she told the panel.
Peter Vanacker, president and chief executive of Neste Corporation, a Finland-based refining company concentrating on low-emission fuels, called for regulations to be in place to adopt pricier sustainable aviation fuel (SAF), but emphasised the urgency.
SAF, made using biofuel, hydrogen or carbon, is currently more costly than traditional fossil jet fuel due to a lower availability of sustainable feedstocks – compared to widely available fossil oil – and the continuing development of new technologies. It has been used in a blend with conventional fuel since 2011, with the hope it will make up the majority as the technology matures.
“The clock is ticking and the climate crisis is here,” he said. “Do not wait until governments all over the world have agreed upon one measure of how to decarbonise the aviation industry.”
Neste has been in discussions with Temasek, the Singapore government, the national airline and Changi airport about using sustainable aviation fuels for flights departing the nation state. Its plant in Singapore will be the firm’s largest once completed in 2023.
Gates: the green premium may exclude poorer countries
Bill Gates, American tech magnate and co-chair of the Bill and Melinda Gates Foundation, echoed how there was “no chance” for consumers, especially those from middle income countries to pay for pricier products that emit less carbon over cheaper alternatives.
“Unless that green premium is very low or is being subsidised, middle income countries will say that the rich countries did most of the emissions, so they’ll have to go solve this thing. And with [the price of] today’s premiums, there’s no chance [they would pay for it],” Gates said in a separate virtual session.
The philanthropist describes the green premium as thedifference in cost between a product that involves emitting carbon and an alternative that does not.
“I think the climate movement got very focused on near-term reductions…what can be done by 2020, and then 2030. The hard areas like how we make steel, cement, beef; how jets make long trips or cross-ocean shipping takes place – I think we are grossly under-invested in the research and new approaches in the hard [to abate] areas,” Gates said on Tuesday.
Over US$5 trillion a year in global subsidies was needed to pay for green premiums to support innovations such as carbon capture technologies and green hydrogen, according to Gates. Investment and government involvement to help increase the scale of projects beyond pilot stage could help to drive the cost down by over 90 per cent.
The cost of new technologies, innovations to curb the climate crisis will have to be reduced dramatically for middle-income countries to adopt them at scale. “The skills of the private sector, the policy and involvement of the government is very critical,” Gates said.
The triangular “chasing arrows” recycling symbol is everywhere: On disposable cups. On shower curtains. On children’s toys.
What a lot of shoppers might not know is that any product can display the sign, even if it isn’t recyclable. It’s false advertising, critics say, and as a result, countless tons of non-recyclable garbage are thrown in the recycling bin each year, choking the recycling system.
Late on Wednesday, California took steps toward becoming the first state to change that. A bill passed by the state’s assembly would ban companies from using the arrows symbol unless they can prove the material is in fact recycled in most California communities, and is used to make new products.
“It’s a basic truth-in-advertising concept,” said California State Senator Ben Allen, a Democrat and the bill’s lead sponsor. “We have a lot of people who are dutifully putting materials into the recycling bins that have the recycling symbols on them, thinking that they’re going to be recycled, but actually, they’re heading straight to the landfill,” he said.
The measure, which is expected to clear the State Senate later this week and be signed into law by Gov. Gavin Newsom, is part of a nascent effort across the country to fix a recycling system that has long been broken.
Though materials like paper or metals are widely recycled, less than 10 percent of plastic consumed in the United States is recycled, according to the most recent estimates by the Environmental Protection Agency. Instead, most plastic is incinerated or dumped in landfills, with the exception of some types of resins, like the kind used for bottled water or soda.
This summer, Maine and Oregon passed laws overhauling their states’ recycling systems by requiring corporations to pay for the cost of recycling their packaging. In Oregon, the law included plans to establish a task force that would evaluate “misleading or confusing claims” related to recycling. Legislation is pending in New York that would, among other things, ban products from displaying misleading claims.
In the past year, a number of environmental organizations have filed lawsuits seeking to combat misleading claims of recyclability by major corporations. Environmental groups have also criticized plans by the oil and gas industry to expand its production of petrochemicals, which are the main building blocks of plastic, because the process is highly polluting and creates new demand for fossil fuels.
The recycling symbol is “subconsciously telling the people buying things, ‘You’re environmentally friendly,’” said Heidi Sanborn, the executive director of the National Stewardship Action Council, which advocates corporations to shoulder more responsibility for recycling their products.
“Nobody should be able to lie to the public,” she said.
In California, the bill won the backing of a coalition of environmental groups, local governments, waste haulers and recyclers. Recycling companies say the move will help them cut down on the non-recyclable trash thrown in recycling bins that needs to be transported, sorted and sent to the landfill.
Pete Keller, vice president of recycling and sustainability at Republic Services, one of the country’s largest waste and recycling companies, said in an interview that more than a fifth of the material his company processes nationwide is non-recyclable garbage. That means that even on its best day, Republic is running at only 80 percent efficiency, processing materials it shouldn’t be processing, he said.
Some of the most common forms of non-recyclable trash marring operations at Republic’s 70 facilities across the United States, which processes six million tons of curbside recycling a year: snack pouches, plastic film, grocery bags and packing material. Plastic bags, in particular, can’t be recycled in most curbside recycling programs and notoriously gum up recycling machines.
“There are a lot of products in the marketplace today that have the chasing arrows that shouldn’t” Mr. Keller said. “There aren’t really any true end markets, or any real way to recover and ultimately recycle those materials in curbside programs.”
The plastics and packaging industry has opposed the bill, saying it would create more confusion for consumers, not less. An industry memo circulated among California lawmakers urges them to oppose the bill unless it is amended, arguing it “would create a new definition of recyclability with unworkable criteria for complex products and single use packaging.”
The letter was signed by industry heavyweights like the American Chemistry Council, the Plastics Industry Association and Ameripen, a packaging industry group. California should wait for Washington to come up with nationwide labeling standards, the groups said.
In discussions over the bill, opposition industry groups also said that if a product is deemed non-recyclable, companies won’t invest in technologies to recycle it. Supporters of the bill say the opposite would be true: Tougher rules would incentivize manufacturers to make their products truly recyclable by investing in new packaging, for example.
Dan Felton, Ameripen’s executive director, expressed concerns that the bill would actually reduce recycling rates. The bill “could have the unintended consequence of sending more packaging material to landfills at the very time when California needs to boost recycling,” he wrote in an email.
The American Chemistry Council referred questions to Ameripen. The Plastics Industry Association, which represents plastic manufacturers, warned that the bill would determine a slew of products to be unrecyclable and therefore would be landfilled. (Supporters of the bill point out those products are landfilled anyway, despite displaying the recycling symbol.)
Environmental groups said that strengthening government oversight is critical. “It’s the wild, wild West of product claims and labeling with no sheriff in town,” Jan Dell, an engineer and founder of The Last Beach Cleanup, an environmental organization, wrote in an email.
The bill would make it a crime for corporations to use the chasing arrows recycling symbol on any product or packaging that hasn’t met the state’s recycling criteria. Products would be considered recyclable if CalRecycle, the state’s recycling department, determines they have a viable end market and meet certain design criteria, including not using toxic chemicals.
In addition to plastics, the bill covers all consumer goods and packaging sold in the state, excluding some products that are already covered by existing recycling laws, such as beverage containers and certain kinds of batteries. Through its environmental advertising laws, California already prohibits companies from using words like “recyclable” or “biodegradable” without supporting evidence.
Renewable energy developers will compete for a share in a £265m subsidy pot as the government aims to support a record number of projects in the sector through a milestone subsidy scheme later this year.
Under the scheme, offshore wind developers will compete for contracts worth up to £200m a year, and onshore wind and solar farms will be in line for their first subsidies in more than five years.
Alongside the £200m funding pot for offshore windfarms, there will be a further £55m available to emerging renewable technologies such as tidal power, of which £24m will be earmarked for floating offshore wind farms.
Dan McGrail, chief executive of the trade organisation Renewable UK, said the scheme could bring forward private investment of over £20bn in a boost to jobs and the UK supply chain, while reducing energy bills and helping the UK to meet its climate targets.
“The sector had called on government to increase the ambition for new renewable energy capacity at the upcoming auction and that is reflected in today’s announcement,” he said.
The government has referred to the upcoming auction as the “biggest ever renewable support scheme” – despite offering less than the £325m and £290m offered in 2015 and 2017 respectively – because the falling cost of renewables means it may secure more renewable energy capacity than the government’s first three auctions combined.
Renewable energy developers will compete for the funds in a reverse auction scheduled for December, in which the lowest-cost projects will secure a contract that guarantees the price for the clean electricity they generate.
In the last auction, offshore wind costs tumbled by a third to record lows of about £40 per megawatt-hour, well below the price of electricity in the wholesale energy market, meaning households are unlikely to face higher charges on their energy bills.
Anne-Marie Trevelyan, the energy minister, said the latest round of the support scheme would “support the next generation of renewable electricity projects needed to power our homes” and help meet the UK’s climate targets.
Boris Johnson set out plans almost a year ago to support 40GW of offshore wind farms by 2030, or enough to power the equivalent of every home in the UK, as part of the government’s plan to “build back greener” from Covid-19.
Heat pumps are considered an important tool in cutting carbon emissions from the UK’s housing stock, which is responsible for about 14% of the country’s total greenhouse gas emissions, mostly due to a reliance on gas heating and poorly insulated homes.
But the UK’s rollout is “seriously lagging” behind other European countries including Poland, Slovakia and Estonia, according to a recent analysis of industry data by Greenpeace.
Doug Parr, Greenpeace UK’s policy director, said that if the government “wants a chance to catch up, it needs a proper strategy and enough cash” to make the cost of installing a heat pump – and upgrading energy efficiency – the same as replacing a gas boiler.
A government spokesman said the strategy paper will set out how the government plans to help the upfront costs of heat pumps to fall in the coming years while keeping “fairness and affordability for both households and taxpayers at the heart of our plans”.
Green hydrogen could revolutionise energy production, helping utilities run more flexible power grids while reducing fossil fuel emissions.
Beyond plans to sell electricity transmitted to energy-hungry Asian nations, Australia is looking to become a leading producer and exporter of green hydrogen by 2030. In addition to meeting the rising demand for clean fuel domestically and overseas, this vision will also bring benefits to the Australian community and nation’s economic prosperity.
While it has been touted as the fuel of the future for the past fifty years, the wider adoption of hydrogen has had several false starts. Nevertheless, a growing number of scientists and investors believe that the falling costs of renewables, electrolysers and fuel cell technology, could help see green hydrogen become commercially viable.
“While countries committed to substantially reducing their emissions by 2030, they realised that they did not have enough tools in the toolbox,” said Alan Finkel, who served as Australia’s chief scientist until last year.
“Many people do not appreciate just how difficult it will be to decarbonise the global energy supply. It is an enormous task, and we have to use all available means to do so,” Finkel said.
Australia’s big bet
Pressure crunching on countries to drive down their greenhouse gas emissions and meet their commitments to clean-up, is driving investment in hydrogen.
Developing hydrogen for export is part of Australia’s wider efforts to wean its economy off its dependency on fossil fuels which raked in A$103 billion (US$73 billion) in export earnings in 2019.
Investment in hydrogen-related projects in Australia started to take off around 2018 with the government committing A$146 million towards developing hydrogen resources along the supply chain to “enhance Australia’s energy security, create Australian jobs and build an export industry valued in the billions”.
HyResource, a knowledge sharing-platform on Australia’s hydrogen industry, estimates that around A$1.5 billion has been funnelled into clean hydrogen projects by Australian governments, industry, and research institutions over the past three years.
There are five operating projects, 14 under construction or in advanced development and 38 projects under development as of May, according to HyResource.
Green hydrogen for homes and industry
Hydrogen Park South Australia (HyP SA), located in the Tonsley Innovation District about 20 km south of Adelaide, is the first project operating in this state, with three others under development.
HyP SA is an Australian-first facility to produce a blend of 5 per cent green hydrogen in natural gas for supply using the existing gas network.
The A$11.4 million project was delivered by Australian Gas Networks (AGN), part of the Australian Gas Infrastructure Group (AGIG), with funding of A$4.9 million from the South Australian Government.
The five-year demonstration plant commenced renewable blended gas supply to over 700 properties near the facility in May this year. It is also providing direct hydrogen supply to industry, and aims to supply hydrogen for transport in the future.
The introduction of green hydrogen reduces the amount of carbon in the gas supply network, without any changes to infrastructure or receiving household appliances, and lays the foundations for scaling-up green hydrogen projects elsewhere.
The success of this demonstration plant will be pivotal for South Australia, which has a reliable renewable energy supply and is working towards net zero carbon emissions by 2050.
Enabling technology – electrolysers
At the heart of the HyP SA facility, is a 1.25 megawatt (MW) Siemens Energy Proton Exchange Membrane (PEM) electrolyser that splits water into hydrogen and oxygen using renewable electricity, capable of producing up to 20 kg of hydrogen an hour.
This is the largest single electrolyser unit in operation in Australia today, although new projects in the development stage include electrolyser units or facilities at 10 MW or more.
PEM electrolysers are a potential solution to tackle the variable conditions by renewable energy generation, according to Siemens Energy. Electrolysers can ramp up when renewable electricity is abundant and switch off when demand is high. Integrating electrolysers into the electricity networks could also support energy stability.
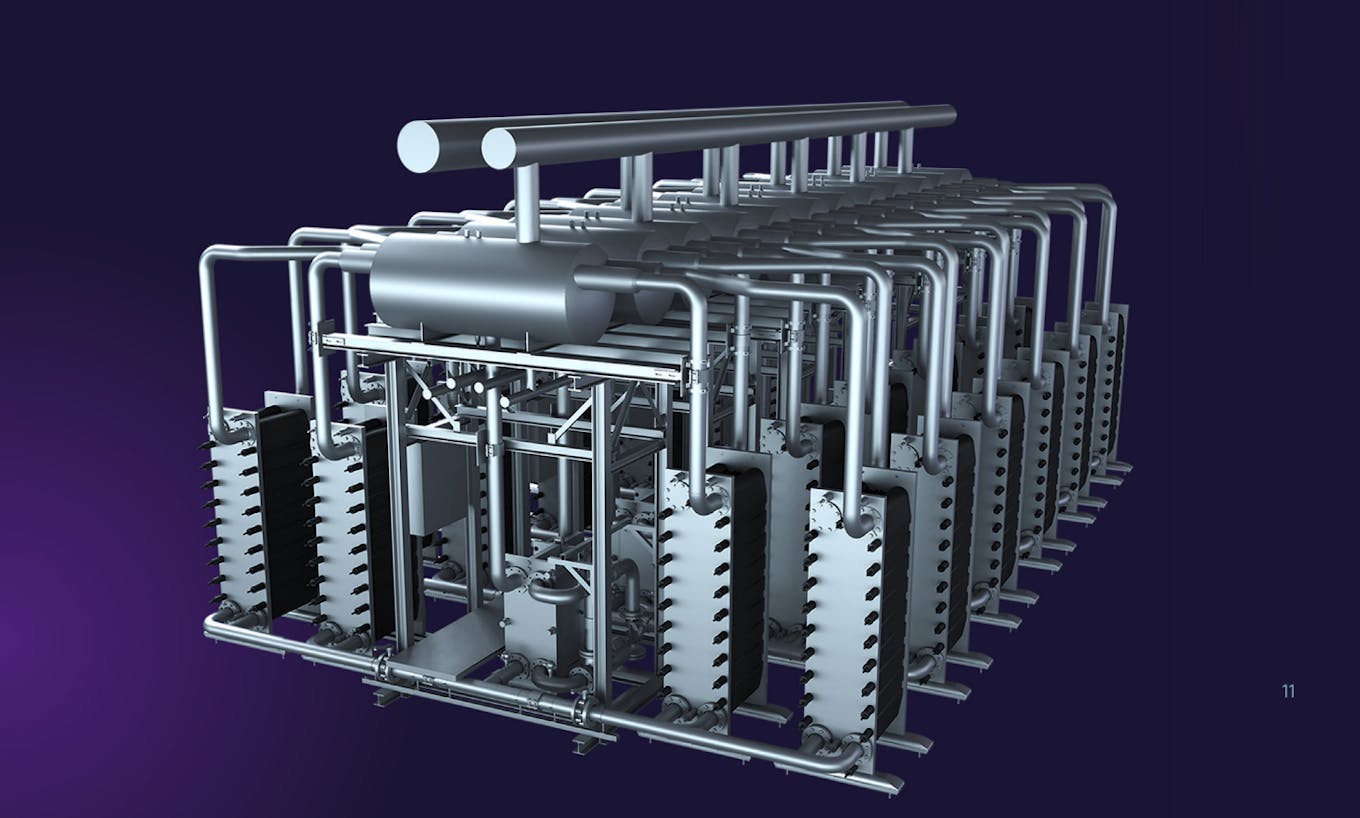
The Siemens Energy electrolysis solution for making green hydrogen is based on the PEM concept. Image: Siemens Energy
There are water resource considerations to take into account, particularly in areas where there is scarcity. The PEM electrolyser uses about 15 litres of water to produce one kg of hydrogen. For future developments, there may be potential use for the oxygen by-product – such as in wastewater treatment.
“It is imperative for hydrogen producers to carefully consider water availability, especially for larger plants in remote areas. We see the potential for wastewater recycling and desalination which would add a surprisingly small amount to overall project costs,” according to Michael Bielinski, managing director of Siemens Energy Australasia.
Nevertheless, cheap renewable energy needs to be rolled out fast enough for this technology to work. This might be difficult when demand from other sectors for wind, solar and other alternative power sources is expected to rise.
Scaling up for decarbonisation
The South Australia demonstration plant is paving the way for other states to decarbonise their gas consumption and has helped to build confidence in the industry that up to 10 per cent green hydrogen natural gas blend is suitable for current use in Australia without disruption to supply.
Two projects with a higher blend rate of 10 per cent green hydrogen are in progress at Hydrogen Park (HyP) Murray Valley in Wodonga, Victoria and Hydrogen Park (HyP) Gladstone in Queensland. HyP SA is also helping to establish a domestic market for renewable hydrogen.
However, the long-term goal is to transition domestic gas supply to 100 per cent renewable by gas by 2050, with a 2040 stretch target. Research by the Australian Hydrogen Centreis underway to understand the feasibility of100 per cent hydrogen replacement of natural gas in Victoria and South Australia would look like. This also provides a strong signal to electrolyser manufacturers for the potential deployment of large-scale electrolysis.
Expanding green hydrogen potential
Natural gas replacement in people’s homes is only one example of green hydrogen use. Part of its appeal is that it could reach parts of the economy other green fuels cannot.
“The electrons in electricity are incredibly versatile, almost magical, but nevertheless, there are limits. By using zero emissions electricity to crack water, we can produce a supply of molecules that can take over where the electrons fall short,” Finkel told Eco-Business.
Finkel believes that hydrogen is the obvious solution for replacing the metallurgical coal in steelmaking that is responsible for 7 per cent or more of global greenhouse gas emissions.
“A large fraction of that metallurgical coal works as a chemical, to reduce the iron oxide to elemental iron, with carbon dioxide as a by-product. Hydrogen can replace coal in that role, acting as a chemical, to reduce the iron oxide to elemental iron, with dihydrogen oxide (water) as the by-product.”
“Ammonia made from clean hydrogen can be used as the chemical feedstock to make zero emissions fertiliser. It is also the leading contender to replace the bunker fuel that powers the world’s maritime fleet,” Finkel said.
Many of the slated export-oriented projects include electrolyser capacities that are equal to or exceed 100 MW. In addition, other hydrogen-related developmental projects have sought environmental approvals for wind and solar generation capacities over 10 GW. Timelines are under development but experts expect few will be operational in the first half of this decade.
For applications that cannot be easily electrified, green hydrogen forms the bridge between renewable electricity and carbon neutral fuels. We have no doubt that clean hydrogen will be essential to power our world in the future.
Michael Bielinski, managing director, Siemens Energy Australasia
The path to economically sustainable hydrogen
Despite being the most abundant element in the universe, hydrogen has faced its fair share of challenges.Risk management firm, DNV, identifies infrastructure and cost as two of biggest hurdles facing a transition to a global hydrogen economy.
The Australian government has set a stretch goal of ‘H2 under $2’, an ambition to reach price parity with fossil hydrogen. Including typical capital investments needed to prepare sites for electrolysis, green hydrogen can be produced for about A$6-9 per kg compared to “grey” hydrogen produced from traditional carbon intensive methods at A$1.40 per kg.
To achieve the price point of under A$2, electrolyser costs will need to fall from between A$2 and A$3 million per MW to A$500,000 per MW with the cost of electricity from solar and wind to half, according to Darren Miller, chief executive of the Australian Renewable Energy Agency (ARENA).
There is hope. Analysis by the IEA in 2019 found that the cost of producing hydrogen from renewable electricity could fall 30 per cent by 2030 as a result of the declining costs of renewables and the scaling up of hydrogen production. The cost of electrolysis equipment has fallen by around 40 per cent in the past five years while the price of solar alone has fallen by 85 per cent in the past decade.
“As more industries adopt green hydrogen energy, the total costs will continue to come down. The key to this is in scaling up production, efficient deployment methodologies and of course the ongoing reduction in renewable energy costs,” Bielinski said.
It is likely that full-scale plants will be powered by dedicated solar and wind resources depending on renewable energy requirements of all Australian hydrogen projects combined, including export.
“The key to cost savings could be hydrogen production facilities built jointly with wind/solar farms, so producers could generate power without incurring grid fees, taxes and levies,” according to analysis by Carolina Dores, co-head of the investment bank, Morgan Stanley European Utility team. While recognising that green hydrogen today is “uneconomical”, Morgan Stanley believes price parity is possible.
Developers and investors also need to factor in policy, regulatory approvals and practical issues that span construction, production, transport and storage and use, export, and demand-side regimes, according to a note by Allens, a law firm. Proving the safety case in both the workplace and for transport and storage remains key to scaling and widespread industry and community acceptance.
The Australian Energy Market Operator (AEMO), who provides forecasting and planning publications for the National Electricity Market (NEM) has developed the Hydrogen Superpower Scenario – placing the hydrogen economy within the realm of possibility.
“Clean hydrogen will be crucial in the global energy transition. For applications that cannot be easily electrified, green hydrogen forms the bridge between renewable electricity and carbon neutral fuels. We have no doubt that clean hydrogen will be essential to power our world in the future,” said Bielinski.
“As a company with a strong portfolio along the energy value chain, Siemens Energy can provide the expertise and innovative technologies that will advance Australia’s hydrogen future and lead the nation’s status as a major energy leader.”