These 11 EU states already meet their 2020 renewable energy targets.
Almost half of the European Union’s (EU) 28 member states have already hit, or are close to hitting, their 2020 renewable energy targets.
But despite this, there has been a gradual slow-down in the rate of renewable energy use across the EU, and some member states have a lot of ground to make up this year.
Those that are already top of the class are: Bulgaria, Croatia, Czech Republic, Denmark, Estonia, Finland, Italy, Hungary, Lithuania, Romania and Sweden. Hot on their heels are Austria, Greece and Latvia, who look certain to hit their targets.
[caption id="attachment_3745" align="aligncenter" width="677"]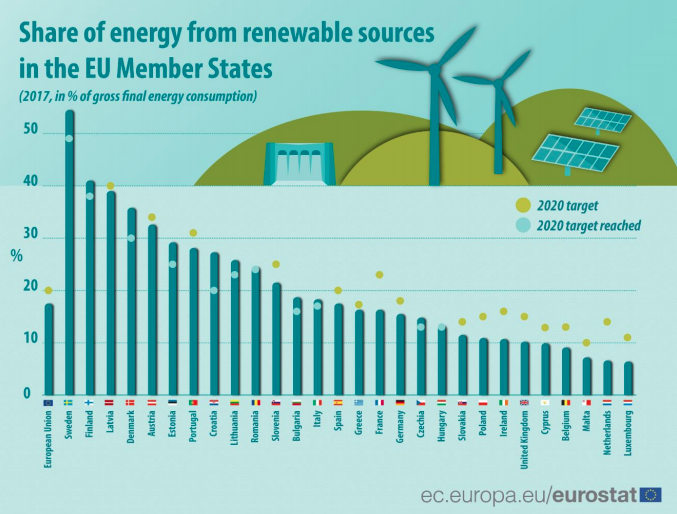 Image: Eurostat[/caption]
It is unlikely to come as a surprise to hear that the Nordics are well-represented among the strongest performers; Sweden came top with 54.5% of its energy coming from renewable sources. That was a long way ahead of the second-placed country, Finland, with 41% – followed by Latvia with 39% and Denmark with 35.8%. Despite its strong performance, Latvia is yet to hit its target but is only around 1% away.
Bringing up the rear, the Netherlands is the furthest away from its goal – 7.4 percentage points (pp) away from its 2020 objective. France is next (6.7 pp), followed by Ireland (5.3 pp) and the UK (4.8 pp).
[caption id="attachment_3744" align="aligncenter" width="802"]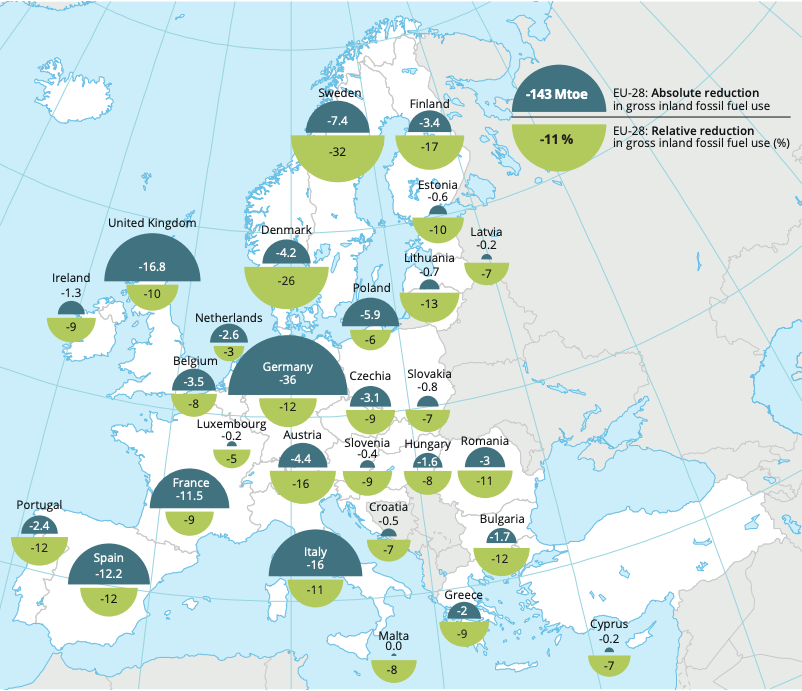 Reductions in fossil fuel use per year, 2016
Image: EEA[/caption]
The first year in which the share of renewable energy was measured across the EU was 2004, when it made up 8.5% of the total. By 2016 that had risen to 17% and 17.5% for 2017.
But while the overall share of renewables being used to meet the energy needs of EU member states has doubled since 2005, the rate of adoption is slowing down. If that trend continues it could cause several member states, and possibly the whole EU, to miss its 2030 target of at least 32% renewable contribution to energy consumption.
The share of renewables increased by an average of 5.5% per year between 2005 and 2015. But that rate of growth decreased by 0.2 percentage points in 2016 and by 0.3 percentage points in 2017 when compared with the 2005-2015 pace of change. This was mostly due to an increase in the total amount of energy consumed – put simply, renewables weren’t able to keep up with demand – and the European Environment Agency is calling for more investment and more ambitious infrastructure projects.
[caption id="attachment_3746" align="aligncenter" width="807"]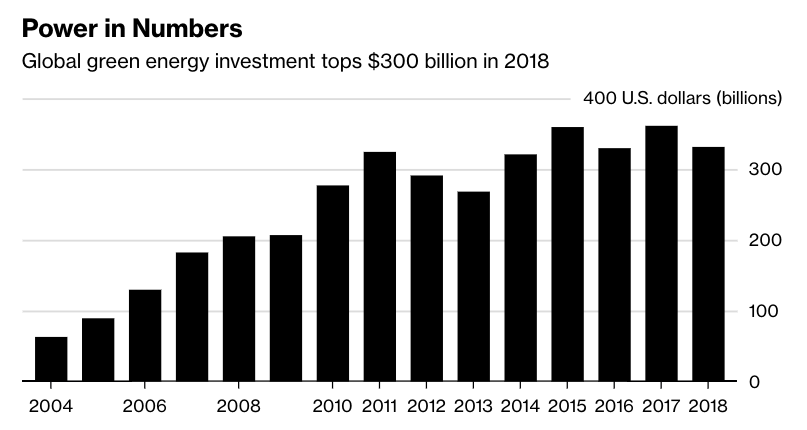 Headline investment figures don’t always tell the whole story
Image: Bloomberg NEF[/caption]
Last year, global investment in renewables like wind and solar energy, along with energy tech such as smart meters, topped $332 billion. But that was a decrease of 8% on the previous year. The biggest player in the clean energy sector for 2018 was China, which invested around $100 billion – a 32% drop on the 2017 figure. There was also a 53% decline in China’s ongoing investment in solar power, prompted by the withdrawal of generous subsidy rates.
Despite that falling trend in investment, there are some positive trends in the clean energy world. Falling costs have been an influence on the overall level of spending, with cost-per-unit falling while the number of installations has risen. Although there was a 24% drop in global solar spending in 2018, solar installation capacity hit 109 gigawatts in 2018, up from 99 gigawatts the previous year, according to Bloomberg.
Global energy demand is expected to grow in the coming decades. The question is how to produce the energy the world will need while also protecting species and habitats and curbing global warming. The World Economic Forum’s System Initiative on Shaping the Future of Energy explores ways to tackle that conundrum including through innovation, partnerships between the public and private sectors, and effective policies that support solar, wind and other clean energy sources.